Measuring the Speed of Water Waves E-practical
Introduction
A wave is an oscillation of something that transfers energy along its path of propagation without transferring any matter. Think of a wave produced by flicking the end of a long rope. A wave will travel along the rope, but no part of the rope is actually moving in the direction of the wave; the parts of the rope are simply going up and down.
If we tied the far end of the rope to a fixed point and oscillated the near end, we would set up a pattern of moving waves on the rope. This is a transverse wave, where the direction of the wave motion is at right angles to the disturbance, which is up and down. This is also like the wave motion in the sea, where the water is going up and down and a surfer can ride the crest of a wave and be propelled forward in the direction of propagation of the wave. The distance between successive crests is called the wavelength. The number of complete waves per second is called the frequency, measured in hertz (Hz). One Hz is one cycle (complete wave) per second. The wavelength is often represented by the Greek letter lambda (λ) and the frequency by v. As shown here, the horizontal axis is time.

The amplitude of the wave is also shown here as A. There is a simple relationship between the speed of the wave, its frequency, and its wavelength:
v = fλ
This is easiest to understand if you just consider the case where the frequency is one cycle per second. In this case, the wave must propagate exactly one wavelength each second.
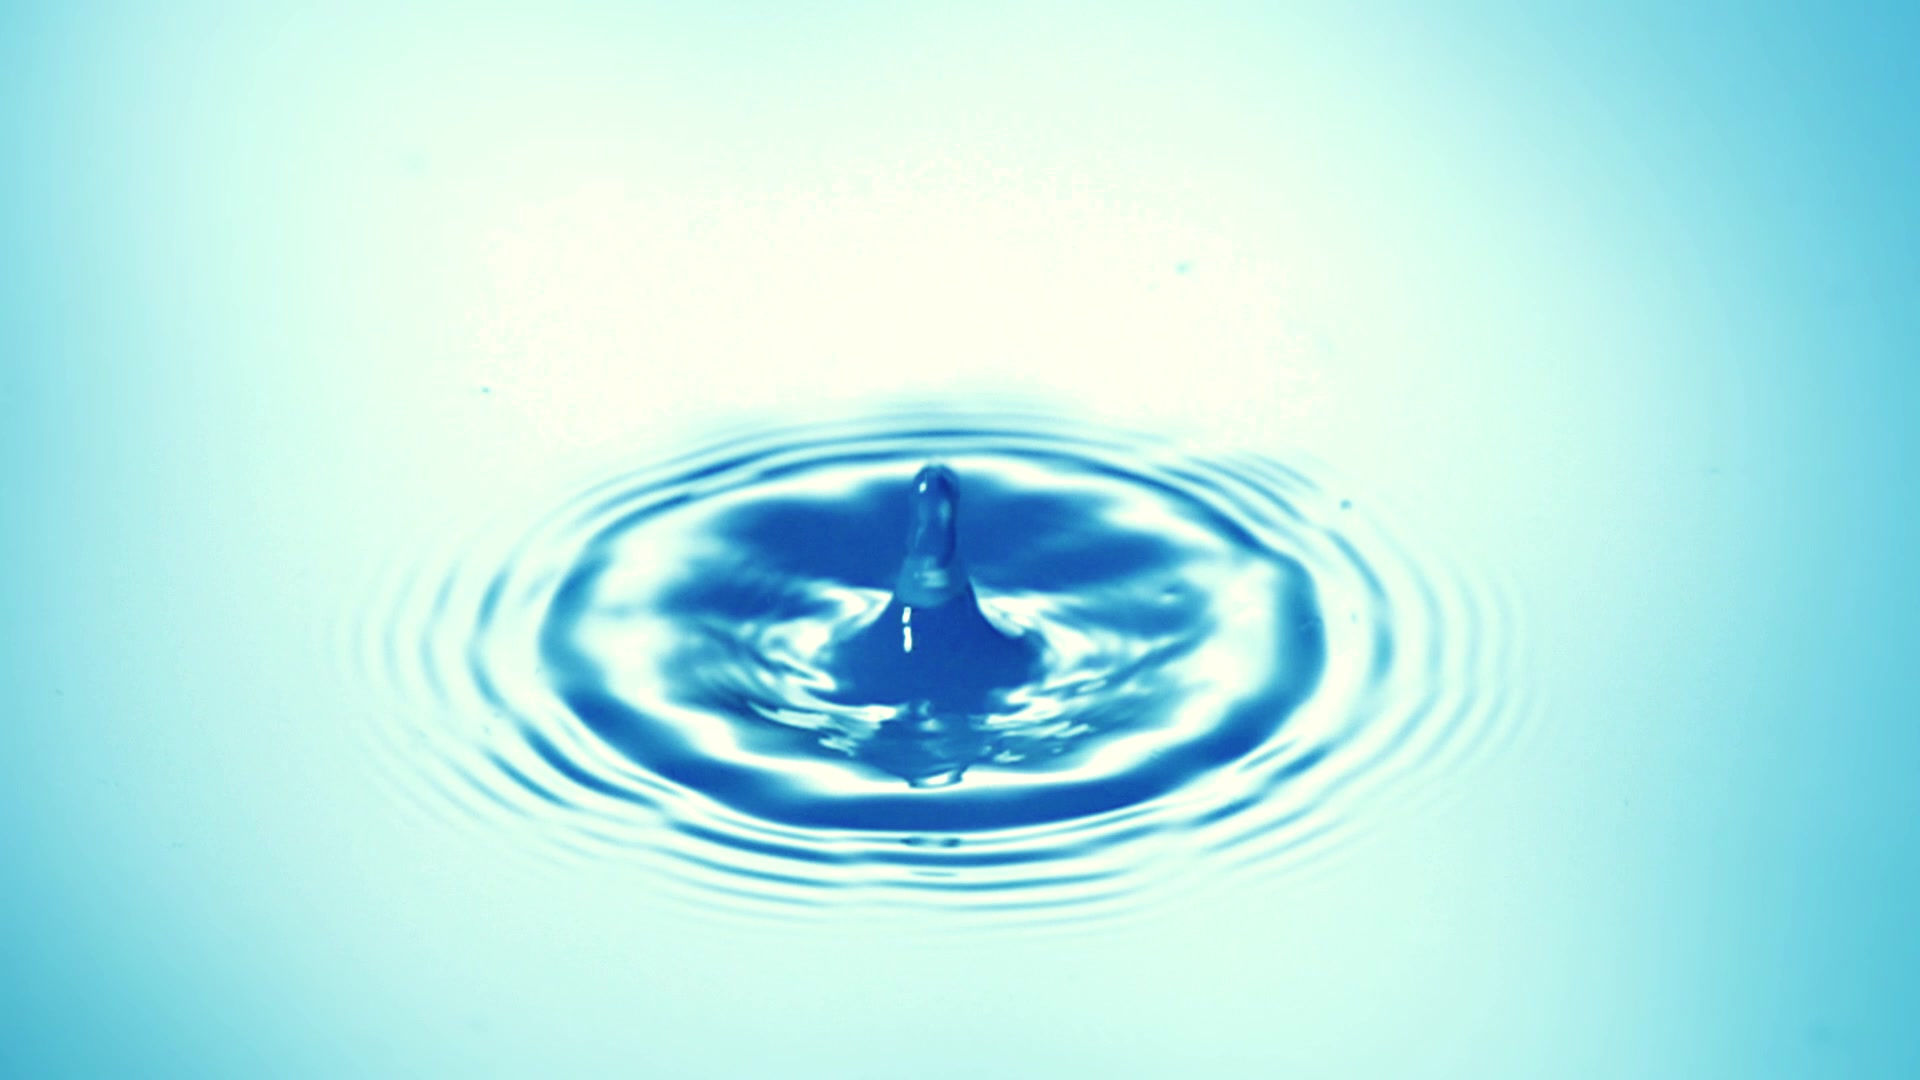
A water ripple is a wave that propagates in water. It is a vertical oscillation of the water. We’ve all seen rain falling onto the surface of a still pond or large puddle. Each raindrop that falls creates a circular wave that moves outwards from the point of contact of the raindrop and the pond. The wave crest travels outwards at constant speed. These waves are a little unusual as there is only one created for each wave, whereas most waves continuously emit crests; for example, the waves breaking onto a shore. In our experiment, we need a continuous supply of crests, and we can arrange this by using a plunger that disturbs the water at regular periods. Like the waves on a rope, this is an example of a transverse wave where the direction of the wave is at right angles to the disturbance, which is up and down.

Realistic experimental technique
E-practicals are 3d, highly realistic emulations based on a blend of theory and the actual practicals, giving an authentic experience of doing the actual practical in a laboratory. Students operate the apparatus, make measurements and obtain their own results. It is designed to reproduce the experience of performing the practical rather than simply demonstrating the underlying physics. Like a real experiment, it can be done badly. Careless setup or measurements can produce poor results, so students have to apply experimental technique and take care with their measurements.
Works directly in a browser
No installation is required. Windows, Mac and suitable mobile devices can run the WebGL e-practical.
See it in Action
This shows how the e-practical can be used. In particular it shows how the student or teacher interacts with the apparatus and how the interaction can be controlled using the mouse or the alternative on-screen controls.
What students do
-
Switch the signal generator on.
-
Dim the room lights using scroll wheel while over the light switch which will make the waves’ shadows easier to see.
-
Lower the blinds by clicking on the switch under the windows.
-
Set the frequency to 2.00Hz and set the strobe to the same.
-
Measure the distance between two crests and record your results.
-
Repeat the same process for the frequencies 2-5Hz as given in the table and record your results.
What you get
The application is supplied as a PowerPoint which provides background, a synopsis of what the student will learn, a description of the Physics involved, a description of the apparatus, the independent and dependent variables, the method, a link to the interactive online e-practical, analysis of the results and further discussion.
E-practical
Runs in a modern web browser. No software installation required. Recommended or desktops but will run successfully on tablets of medium to large size with a browser that supports WebGL.
School/Department licence £9.99
Valid for 1 year